
Female Hormone Level Chart: What Normal Ranges Look Like
See how estrogen, progesterone, FSH, and LH shift across your cycle, perimenopause, and menopause with this female hormone level chart and normal range guide.
You check your lab report after weeks of disrupted sleep, mood changes, heavier or less predictable periods, or a body that suddenly feels unfamiliar. The estradiol and FSH numbers look precise, so it's natural to search for the one value that explains everything. Unfortunately, a single result rarely works that way.
A female hormone level chart is more useful as a context map than as a diagnostic rulebook. It shows how estradiol, progesterone, FSH, and LH may shift during a menstrual cycle and across the menopause transition, but the meaning of each result depends on timing, symptoms, age, medications, and reproductive history.
Table of Contents
- Understanding the Basics of the Female Hormone Level Chart
- Decoding Hormone Levels During the Menstrual Cycle
- Tracking FSH and LH Changes Across the Menopause Transition
- Analyzing Estradiol and Progesterone Trends by Age
- Comparing Hormone Ranges in Menopause and Postmenopause
- Understanding When Lab Values Do Not Equal Diagnosis
- Identifying the Right Time to Request Hormone Testing
- Applying Knowledge to Manage Symptoms and Next Steps
Understanding the Basics of the Female Hormone Level Chart
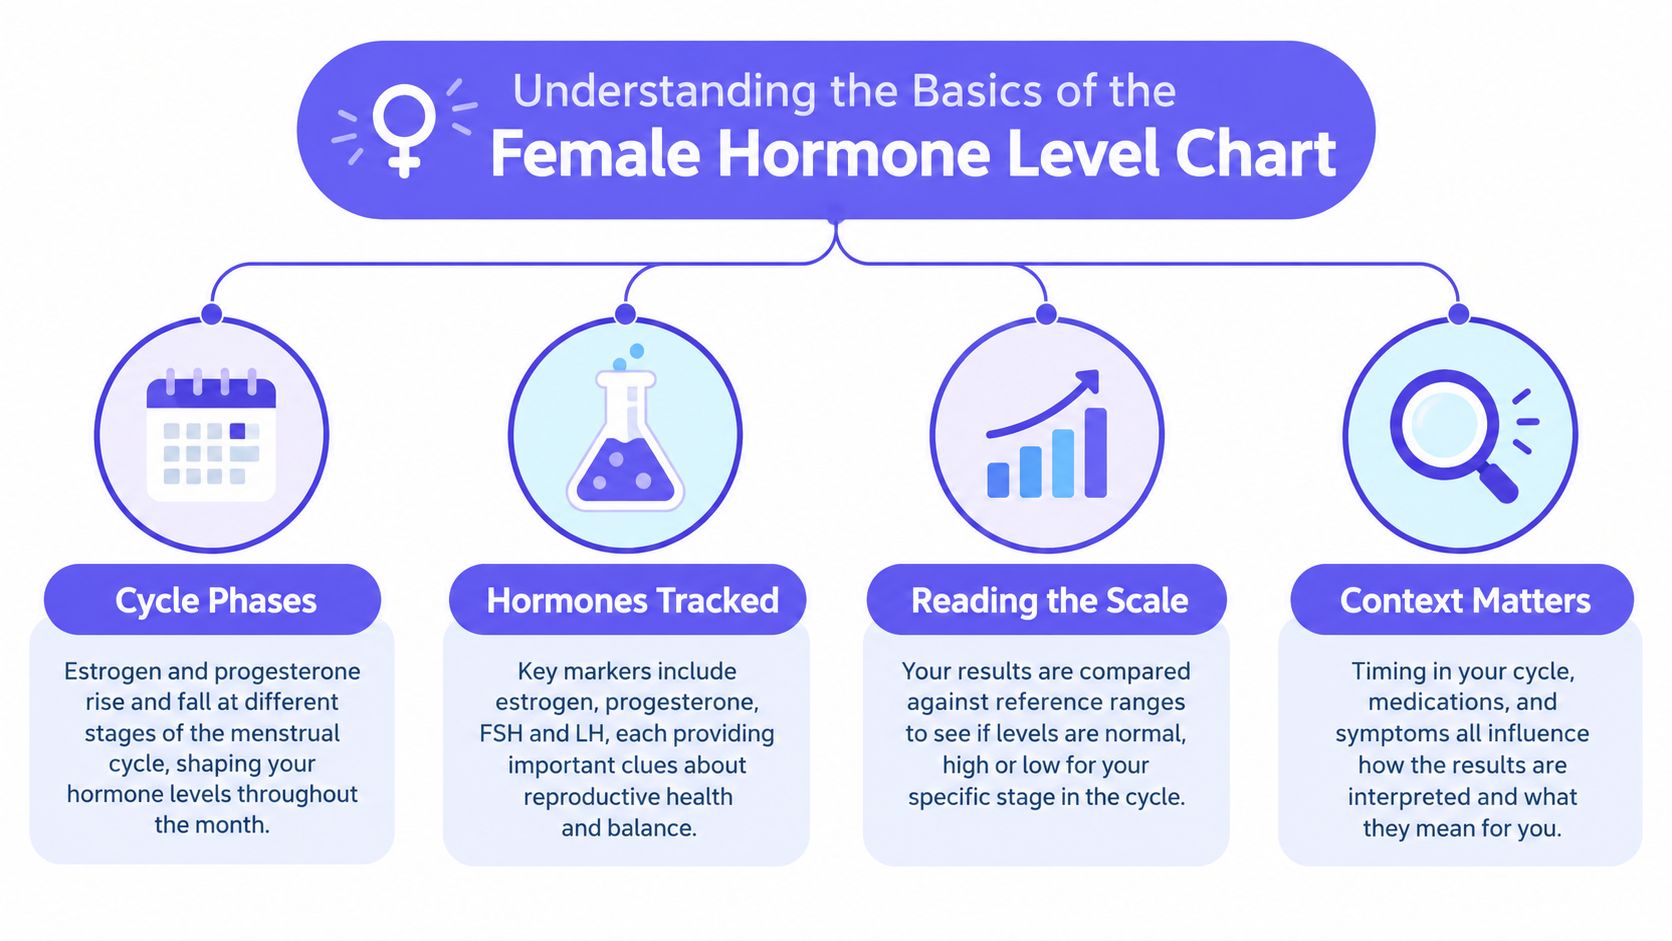
A patient might arrive with one question: “Is this hormone level normal?” A more useful starting question is, “Normal for which phase, and normal for what purpose?” Estradiol may be expected to rise before ovulation, progesterone may become more prominent afterward, and FSH may change as the ovaries respond differently over time. The same number can therefore carry different meanings in different contexts.
Estradiol, the main form of estrogen during the reproductive years, supports follicle development and changes substantially across the cycle. Progesterone rises after ovulation, when the follicle that released the egg becomes the corpus luteum. It helps prepare the uterine lining for a possible pregnancy.
The signals behind the ovarian response
FSH, or follicle-stimulating hormone, comes from the pituitary gland and encourages ovarian follicles to develop. LH, or luteinizing hormone, also comes from the pituitary and helps coordinate ovulation and the hormonal activity that follows it. These hormones are signals from the brain to the ovaries, while estradiol and progesterone are part of the ovarian response.
A useful mental model is to think of the chart as a conversation rather than a scorecard:
- FSH and LH send instructions.
- Estradiol reflects activity in developing follicles.
- Progesterone reflects activity after ovulation.
- Symptoms and cycle patterns show how those changes are experienced.
Practical rule: A lab value isn't meaningful until you know the cycle timing, the laboratory units, and the clinical question behind the test.
This foundation prevents a common mistake. A low progesterone result may be expected before ovulation but less expected after it. An FSH result that appears ordinary on one day may not rule out hormonal transition because FSH can fluctuate. The chart helps you ask better questions, but it can't replace interpretation by a qualified clinician.
Decoding Hormone Levels During the Menstrual Cycle
A typical menstrual cycle is dynamic. Estradiol and progesterone don't remain at one stable level, and a blood draw captures only one moment in that movement. In a typical 28-day cycle, estradiol is around 40–100 pg/mL during days 1–13, the follicular phase. It rises to about 100–400 pg/mL around ovulation, then falls back to approximately 40–250 pg/mL during the luteal phase, according to the clinical reference summarized in this research on menstrual hormone patterns.
Progesterone follows a different shape. It is roughly 300 pg/mL in the follicular phase, can reach about 300–3000 pg/mL around ovulation, and rises to approximately 3000–10,000 pg/mL in the luteal phase, based on the same reference. The key point isn't that every person will match these values. The key point is the sequence: both hormones are relatively low at the start, estradiol rises before ovulation, and progesterone becomes more prominent afterward.
Reading the phases as a sequence
During the follicular phase, follicles develop and estradiol gradually increases. Near ovulation, the estradiol rise is associated with the hormonal signaling that helps coordinate the release of an egg. After ovulation, progesterone rises as the body enters the luteal phase.
| Cycle phase | Estradiol pattern | Progesterone pattern | Interpretation |
|---|---|---|---|
| Follicular phase | About 40–100 pg/mL | Roughly 300 pg/mL | Follicles are developing |
| Around ovulation | About 100–400 pg/mL | About 300–3000 pg/mL | Hormones are shifting rapidly |
| Luteal phase | About 40–250 pg/mL | About 3000–10,000 pg/mL | Post-ovulation activity is more prominent |
The same table can be misread if you ignore timing. A result taken early in the cycle shouldn't be compared with a luteal-phase reference range. If your cycles are irregular, identifying the phase may be difficult, which is why a structured menstrual cycle mapping test can be relevant for some clinical questions.
A cycle calendar, such as this menstrual cycle calculator, can help you record bleeding dates and estimate where a test falls in the cycle. It can't confirm ovulation or diagnose a hormonal disorder, but it gives your clinician useful context.
Why one result can be misleading
A high or low result isn't automatically abnormal. The result may reflect normal phase variation, an unusually early or late ovulation, a cycle without ovulation, hormonal contraception, fertility treatment, or a laboratory method that uses different reference intervals. Interpretation becomes stronger when the result is connected to the cycle pattern and the reason the test was ordered.
Tracking FSH and LH Changes Across the Menopause Transition
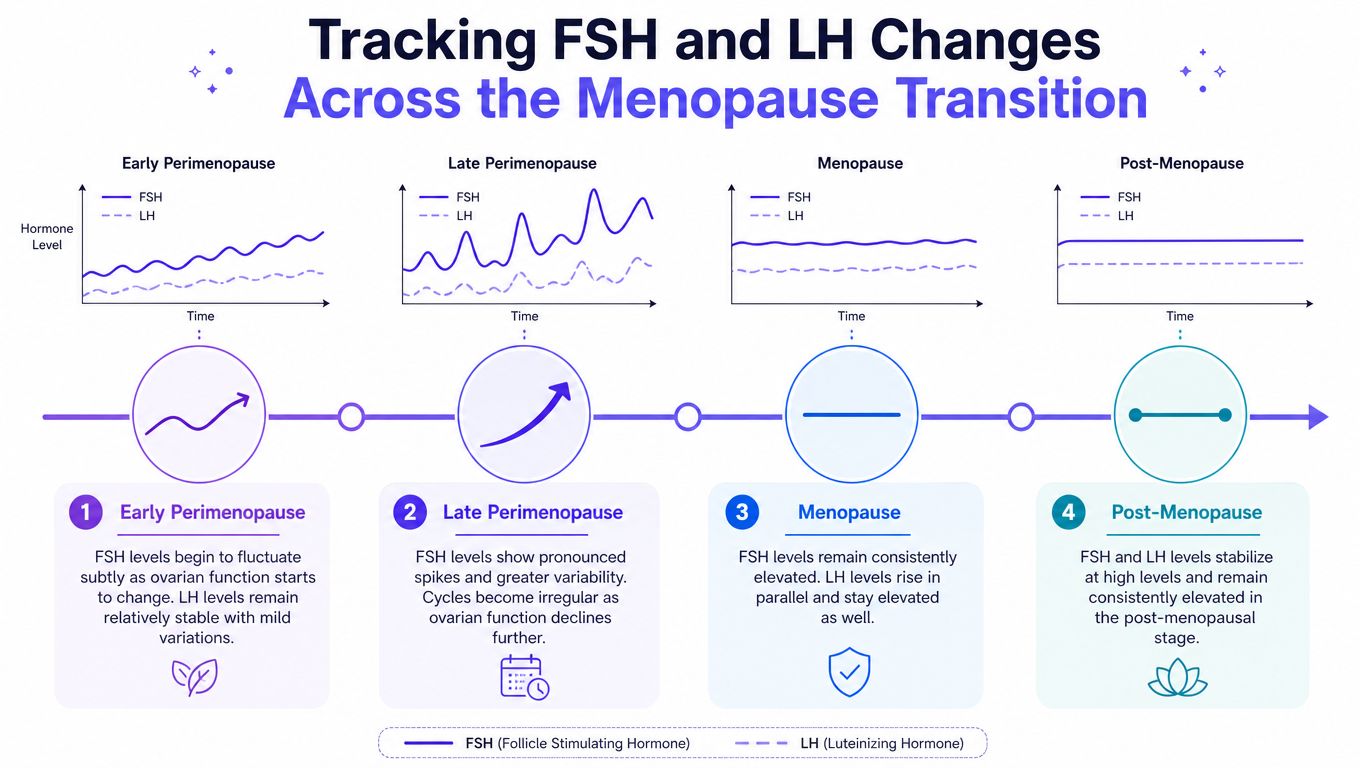
The menopause transition changes the relationship between the ovaries and the pituitary gland. As ovarian follicles become depleted, estradiol, inhibin, and antimüllerian hormone decline overall, while FSH and LH increase. The process isn't smooth, so a person may move through periods of stronger and weaker ovarian activity rather than experiencing one predictable downward line.
Why the chart looks less orderly
In earlier perimenopause, FSH may fluctuate while periods still appear relatively regular. Later, cycles may become more irregular and FSH spikes may become more pronounced. After menopause, FSH levels remain high and LH also rises, although neither hormone should be interpreted without the clinical context.
Reference data illustrates a broader age-related pattern, but it shouldn't be treated as a personal forecast. One summary reports average estradiol of about 110.0±50.0 pg/mL at ages 19–29, 100.0±45.0 pg/mL at 30–39, 65.0±30.0 pg/mL at 40–49, and 25.0±10.0 pg/mL at 50–59. The same table reports progesterone falling from approximately 3.5±2.5 ng/mL at ages 19–29 to 0.3±0.2 ng/mL at ages 50–59. These figures come from the reference table on hormone changes across the menopause transition.
The units matter here. Estradiol and progesterone may be reported in different units, and a result can't be compared accurately with a chart until the units and laboratory range match.
The following video offers another visual way to think about the transition:
▶ PlayWhy symptoms can begin before periods stop
Estradiol may fluctuate sharply before it settles at lower postmenopausal levels. Progesterone can become less predictable when ovulation occurs less consistently. Those changes can affect bleeding patterns and may coincide with symptoms such as sleep disruption, mood changes, or temperature sensitivity.
The biological explanation is important because it corrects a common assumption. A person doesn't need to wait until hormone production reaches a permanently low level before symptoms become relevant. The transition can be clinically meaningful while the chart still looks inconsistent.
Analyzing Estradiol and Progesterone Trends by Age
An age-based chart can look like an answer, especially when a result seems higher or lower than expected. It is better used as a context map. Estradiol varies with cycle phase, ovulation, ovarian activity, medication, assay method, and whether menopause has been established. Age adds background, but it cannot identify what one person's hormone level should be on one particular day.
One clinical reference lists adult female estradiol ranges of less than 300 pmol/L in the early follicular phase, approximately 100–1400 pmol/L in the luteal phase, and less than 200 pmol/L after menopause. These ranges are summarized in this clinical guide to hormone testing and interpretation. The different phase-based ranges show why a single universal “normal” estradiol value cannot serve as a diagnostic rule.
A trend is not the same as a diagnosis
Across the reproductive years and the menopause transition, ovarian hormone production often becomes less predictable before it declines. The pace varies. One person may notice symptoms during sharp estradiol fluctuations, while another may have few symptoms despite a result that appears low.
Progesterone adds another layer. Its level depends partly on whether ovulation occurred and when the sample was taken. A reading from a cycle without ovulation cannot be interpreted like a reading from the luteal phase.
Read a result alongside:
- Cycle information, including bleeding regularity and likely ovulation timing.
- Symptoms, such as sleep changes, hot flashes, vaginal symptoms, mood shifts, or altered energy.
- Treatment history, including hormonal contraception or menopausal hormone therapy.
- The clinical purpose, such as fertility evaluation or investigation of ovarian insufficiency.
A low estradiol result may fit the early follicular phase but look unexpected in the luteal phase. During perimenopause, a sample from one day may also miss higher or lower levels occurring later. Hormone therapy can complicate the picture further because the measured hormone may not capture the treatment's full biological effect.
Use age as context, not a verdict
Start with the laboratory's units and reference interval before comparing a result with a chart. Check whether the sample was collected at a phase when that comparison makes sense. This explanation of normal estradiol levels can clarify terminology, but a broad range still cannot diagnose an individual.
During perimenopause, a symptom pattern and menstrual history may provide more useful direction than a random hormone value. Estradiol testing is often unnecessary for diagnosing menopause, since timing, assay type, and hormone therapy can make an isolated result misleading.
Comparing Hormone Ranges in Menopause and Postmenopause
Menopause and postmenopause do not create one fixed laboratory profile. Ovarian activity shifts from a cycling pattern to lower, generally steadier hormone production. FSH and LH usually remain higher than during the reproductive years. The female hormone level chart therefore works better as a context map than as a set of diagnostic cutoffs.
The comparison below shows the direction of change, rather than a personal target:
| Life stage | Estradiol pattern | Progesterone pattern | What the comparison means |
|---|---|---|---|
| Reproductive years | Changes with cycle phase | Rises after ovulation | Collection timing shapes interpretation |
| Perimenopause | May fluctuate considerably | Ovulation becomes less predictable | Symptoms and bleeding patterns add important context |
| Postmenopause | Generally lower than reproductive-phase levels | Generally low because ovulation has stopped | Results should be compared with postmenopausal references |
Clinical reference ranges for estradiol differ between the early follicular phase, the luteal phase, and postmenopause. That difference does not mean every result outside a laboratory interval signals disease. It means the comparison group has changed. A value that seems low beside a reproductive-phase range may fit the expected postmenopausal pattern.
Avoid comparing unlike stages
Before ovulation, progesterone may be low. After ovulation, it can rise substantially. A postmenopausal result is not expected to follow that cycle-based pattern because regular ovulation has ended. Applying a luteal-phase expectation to a postmenopausal result can create concern without adding useful information.
The opposite mistake also matters. A result within a postmenopausal reference range may not explain new symptoms. Sleep disorders, thyroid disease, medication effects, stress, anemia, and other health conditions can produce similar changes. The chart helps frame the discussion, while the symptom pattern and clinical history help determine what deserves attention.
Use the life-stage context carefully
A menopause calculator, such as this menopause age calculator, may help organize personal history and set expectations. An estimated age cannot establish menopause, and one blood test cannot confirm the whole transition. Interpretation still depends on menstrual history, symptoms, reproductive status, treatment, and the reason testing was requested.
The practical question is not whether one number matches a chart. It is whether the result fits the person's life stage and the question the test was meant to answer.
Understanding When Lab Values Do Not Equal Diagnosis
The most important correction to the usual female hormone level chart is simple: one hormone number doesn't equal one diagnosis. FSH and estradiol can be useful when menopause status is unclear, but they aren't reliable routine screening tests for every person in perimenopause.
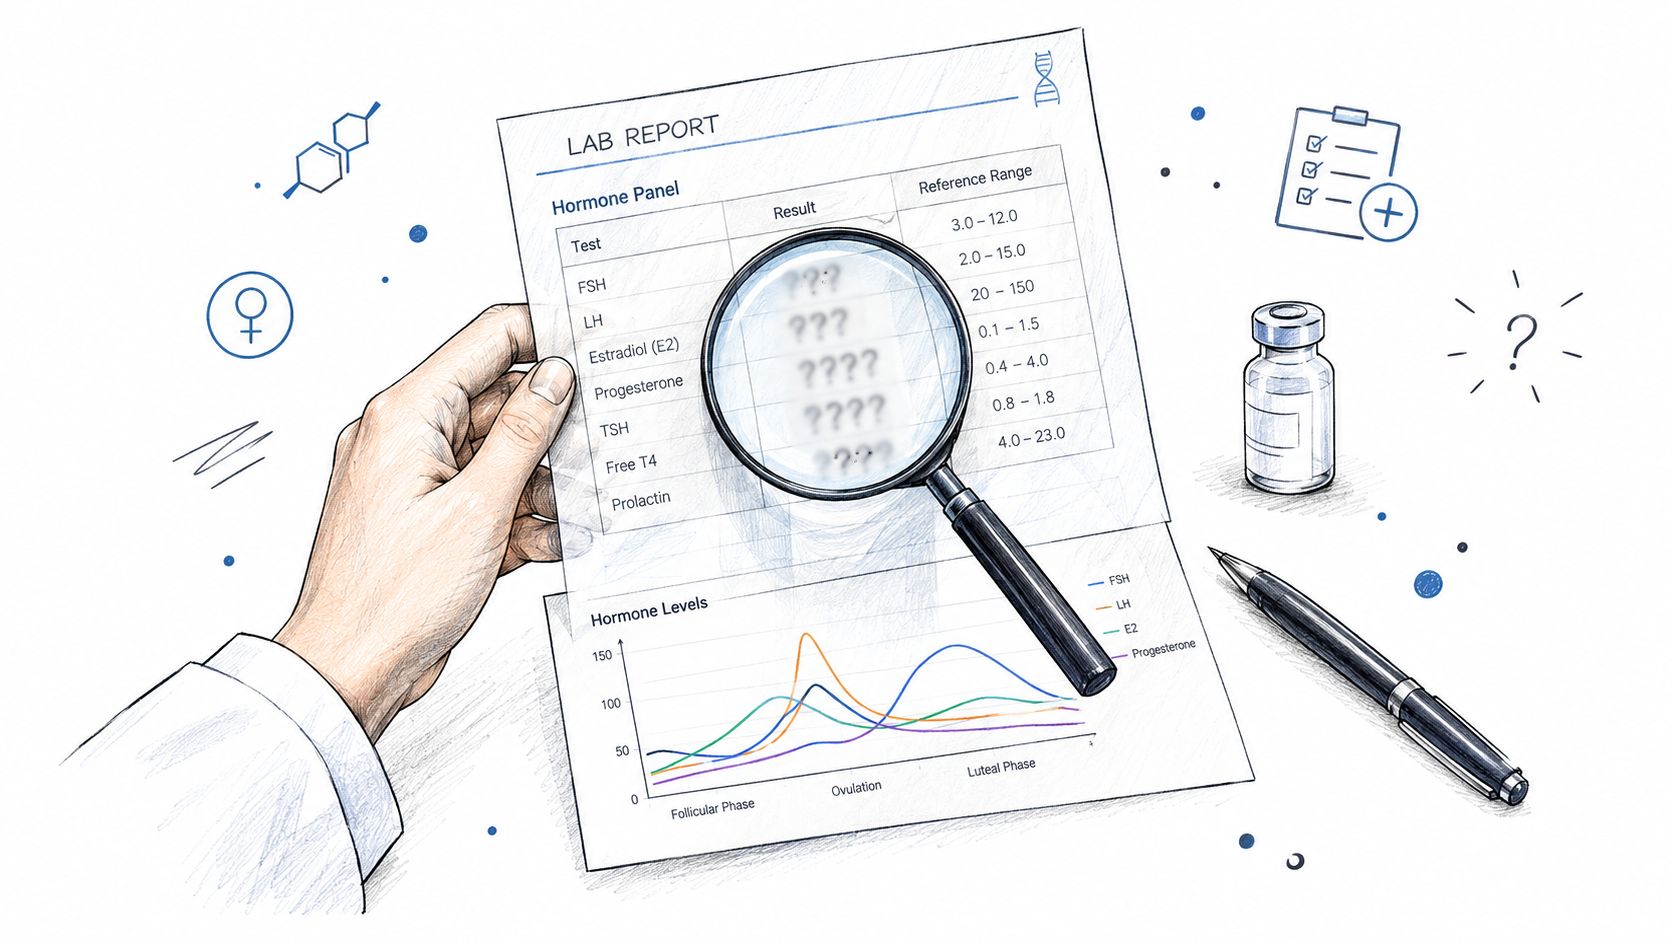
FSH fluctuates widely during perimenopause. A normal result therefore doesn't exclude the transition, while a high result can support the possibility of declining ovarian function. Estradiol can also move up and down, so a normal or high value doesn't prove that perimenopause isn't occurring.
Why the snapshot fails
Imagine someone has several months of new night waking, changing periods, and hot flashes. A blood test taken on a day when estradiol is temporarily higher may look reassuring. That result doesn't erase the symptoms or prove that ovarian activity is stable. It describes the hormone environment at the time of the draw.
A practical interpretation standard is:
- A normal FSH doesn't rule out perimenopause.
- An FSH that is above normal supports ovarian decline but isn't a complete diagnosis by itself.
- Estradiol must be interpreted with timing, assay, treatment, and symptoms.
- A repeated pattern is more informative than an isolated number when testing is clinically indicated.
A normal result can answer what your hormones were doing on the day of the blood draw. It may not answer what your hormones have been doing across the transition.
For women under 40 with suspected premature ovarian insufficiency, diagnosis typically requires raised gonadotropins on at least two tests 4–6 weeks apart. Guidance commonly cites FSH above 30 IU/L for menopause or ovarian decline and above 40 IU/L for premature ovarian insufficiency in younger women, as outlined in this menopause testing guidance.
Let the clinical question lead
If you're around the usual menopause age and your symptoms and menstrual history fit, a clinician may not need a hormone panel to identify the transition. If you're younger, have had a hysterectomy, use treatment that changes bleeding, or have symptoms that could reflect another condition, testing may be more useful.
For a plain-language discussion of what testing can and can't establish, see this guide to testing for perimenopause. The goal isn't to dismiss lab values. It's to prevent a precise-looking number from carrying more certainty than it deserves.
Identifying the Right Time to Request Hormone Testing
Testing makes the most sense when it answers a specific clinical question. For women around 45–55, current guidance generally favors symptom-based assessment because FSH, estradiol, and AMH can fluctuate too much for one blood draw to confirm menopause status reliably, as described in the 2026 menopause clinical practice guideline.
Ask your clinician whether testing is appropriate when:
You're under 40 and have signs of ovarian insufficiency. Irregular or absent periods, hot flashes, or fertility concerns at a younger age may justify targeted assessment. If premature ovarian insufficiency is suspected, the diagnosis generally relies on repeat gonadotropin testing rather than one result.
Menopause status is unclear. This may happen after hysterectomy, when bleeding can't be used as a guide, or when treatment has altered the usual pattern. FSH and estradiol may help answer a narrower question, but neither should be treated as a standalone verdict.
You're planning fertility preservation or investigating reproductive function. In this setting, clinicians may combine hormone tests with the menstrual history, ultrasound findings, and other fertility information. The purpose is assessment and planning, not a guarantee about future fertility.
You're following a treatment or exposure that may affect ovarian function. Gonadotoxic treatment follow-up requires a clinician-directed plan and may involve repeated assessments over time.
Prepare the information that gives the result meaning
Before the appointment, record recent bleeding patterns, symptoms, cycle day if known, current contraception, hormone therapy, supplements, and the reason you want testing. Ask which hormone is being measured, what units the laboratory uses, and how the result will change the next clinical decision.
A general Longevity Clinics review guide may help you understand the types of services marketed around hormone testing, but commercial testing shouldn't replace a clinician who can interpret results in your medical context. You can also review practical questions in this guide to testing for menopause.
Applying Knowledge to Manage Symptoms and Next Steps
A chart becomes useful when it changes what you do next. If sleep has deteriorated, mood feels unfamiliar, or weight has shifted, don't assume one hormone result has identified the cause. Perimenopause is phased and individual. Estradiol and progesterone can vary across people and across stages, and FSH may rise without matching symptoms in a simple one-to-one way, as discussed in recent research on stage-specific hormonal change.
Start with a pattern rather than a perfect number. Record the symptom, when it appears, what was happening beforehand, and how it affects daily life. For example, note whether night waking occurs near bleeding changes, whether mood shifts follow several nights of poor sleep, or whether hot flashes cluster at particular times.
Turn observations into a clinical conversation
Bring a concise record to your clinician and describe the effect, not only the symptom label. “I wake repeatedly and feel unrefreshed at work” gives more useful information than “my hormones are off.” Ask whether the pattern fits perimenopause and whether other explanations, such as thyroid problems, medication effects, or sleep disorders, should be considered.
A practical tracking set might include:
- Sleep: bedtime, waking, night sweats, and morning energy.
- Mood: irritability, anxiety, low mood, and emotional resilience.
- Cycle: bleeding dates, flow changes, skipped periods, and spotting.
- Body changes: appetite, bloating, weight trend, and exercise tolerance.
- Treatment context: contraception, hormone therapy, supplements, and medication changes.
Support the symptom, not just the number
If sleep is the main problem, establish consistent sleep and wake times, review caffeine and alcohol timing, and seek medical advice for persistent insomnia or suspected sleep apnea. If mood changes are prominent, discuss mental health support rather than assuming that a hormone chart provides the whole explanation. If weight or metabolic health is the concern, focus on sustainable meals, resistance exercise, daily movement, and medical review rather than chasing a single estradiol target.
The purpose of tracking isn't to monitor yourself anxiously. It's to identify patterns that help you and your clinician choose appropriate support. A normal hormone result doesn't invalidate your experience, and a low result doesn't automatically dictate one treatment.
The most useful chart connects a result to timing, symptoms, and a decision. It doesn't promise that one number can explain your whole body.
Lila brings symptom, mood, sleep, energy, meal, and cycle tracking into one place, then uses daily check-ins and a chat-based coach to provide personalized guidance for concerns such as sleep disruption, mood changes, hot flashes, and weight gain. If you want structured support while turning hormone and symptom patterns into practical next steps, visit Lila.
Get Lila, your personal coach for perimenopause.
Built for women in their 40s. 24/7 coaching, in your pocket.